
![]()
![]()
![]()
![]()
ALFOSC spectroscopic observations:
|
|
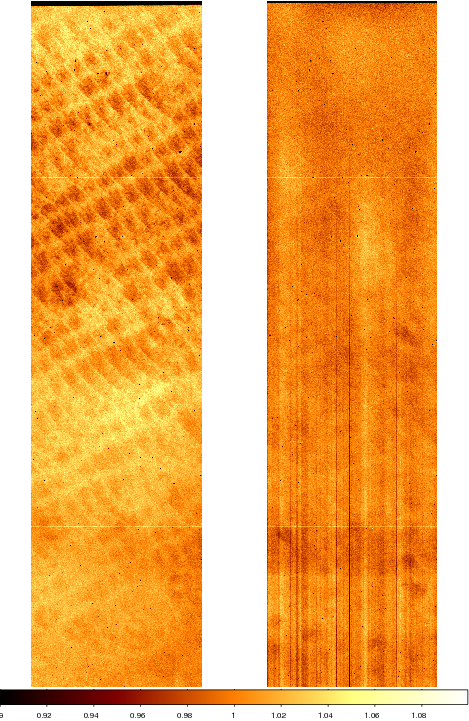
The current ALFOSC CCD#8 is has a wafer-like etching pattern in the
response as a function of the position on the CCD, which is
particularly visible in the U and B bands. This pattern
can be flatfielded out, if a proper flatfield can be obtained. Spectroscopic flatfields rely on the calibration unit of ALFOSC, which houses a red Halogen lamp for flatfielding. In the U and B region the lamp is dim, and consequently the blue flatfield spectra are swamped by diffuse scattered red light. The resulting flat fields are not sufficient to get rid of the wafer-like pattern, and due to this it is difficult to reach S/N>40 even in well-illuminated spectra. On the two spectroscopic flatfields on the left, taken with grism #16 giving 3500-5060A, the bluest wavelengths are at the top of the image. The rightmost flatfield is obtained with the standard internal Halogen flatfield lamp. One can clearly see the 'slit transfer function' at the bottom of the image: the vertical striping showing evidence for obscuring dust flakes on the slit. But gradually further towards the UV (top) the slit illumination pattern is swamped by scattered light. The wafer-like pattern is not probed using this calibration setup. A novel technique was applied to get at the leftmost of these two flatfields: this one is the result of interpolation of UBV imaging sky flats. As we know what is the approximate wavelength for each pixel on the CCD in the spectral direction (up-down), we know how to interpolate between the U, B, and V images to get the correct mix of colours along the dispersion. As the spectra run from to blue (top) to red (bottom), the top pixels have a lot of U-band weight, while the bottom pixels have a large V-band weight. Populating the 'spectral skyflat' by interpolating the imaging sky flats row by row, we get the spectral-imaging skyflat shown on the far left, bringing out the typical etching pattern that the E2V chips have in the far blue. To allow the interpolation, the UBV sky flats were first bias subtracted, and scaled to unity by a single factor applied to the complete frame. In the reduction of the spectra shown below, we did not account for the dust flakes on the slit. The so called 'slit transfer function' can be obtained from spectral sky flats, and may especially be important for extended objects.
|
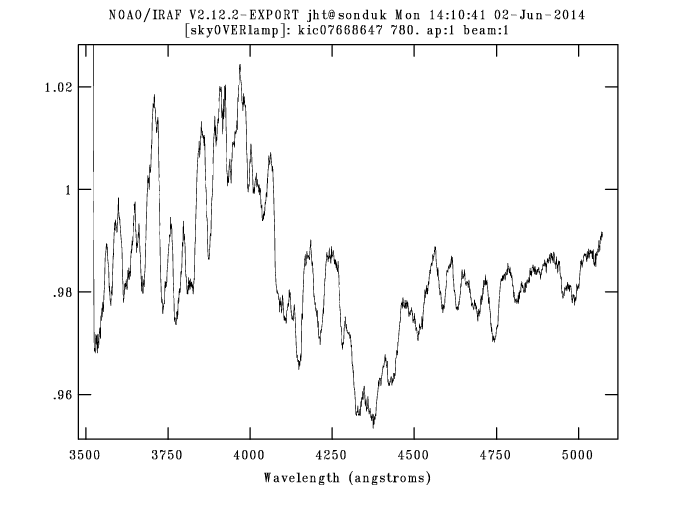
Below we show the result of the spectral reduction, comparing the two methods. On the left a spectrum of a subdwarf B star, with the top spectrum flatfielded with the new method. The new method results in a smoother continuum and proper line shapes. High S/N is achieved.
The right plot shows the quotient of the two spectra, showing the magnitude of the wafer-like pattern, when normalized at unity.

| Back to top | Last modified: May 31 2023 |