ALFOSC CCD8 with CCD3COM controller
Normallly the CCD8 bias level and overscan is very stable.
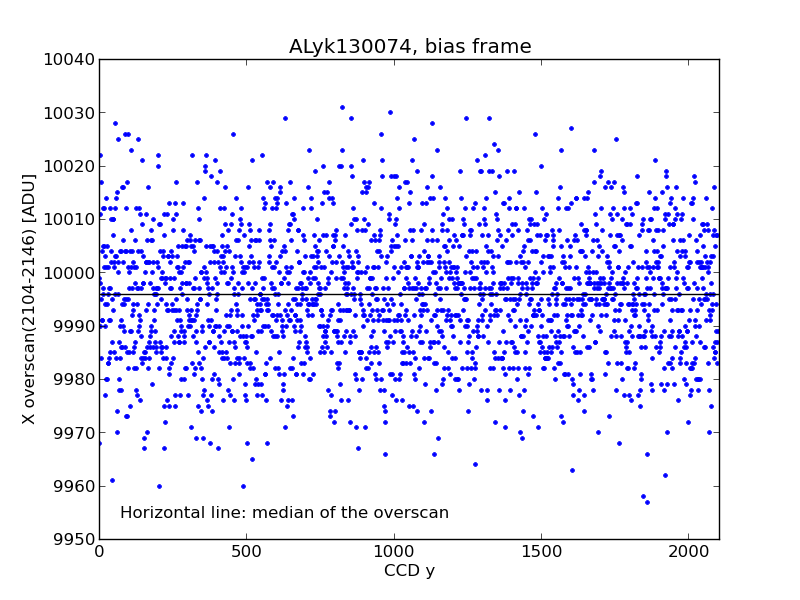
Below is an example of a typical x-overscan
and
a gray-scale image of a typical bias-frame.
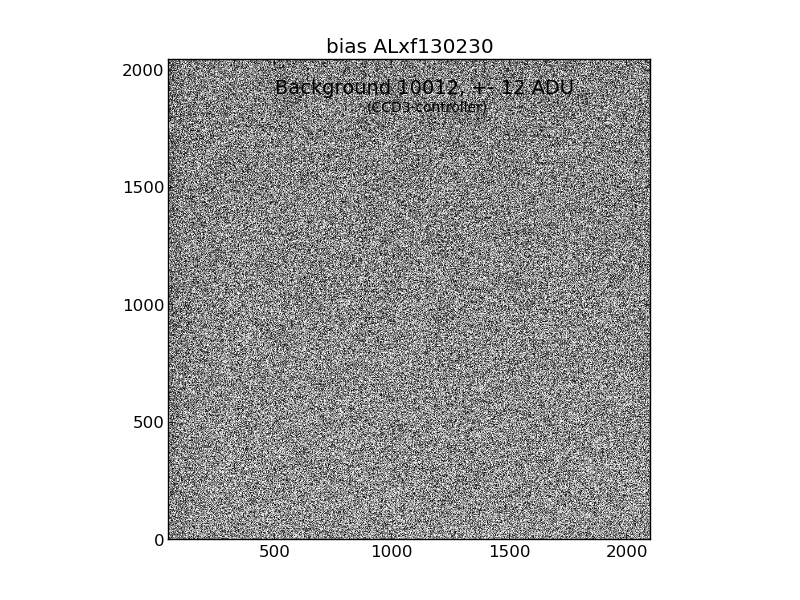
The typical standard deviation of a bias frame is about 12 ADUs.
After standard data reductions (overscan subtraction and trim) the master
bias frame is typically flat, without any apparent structure (below).
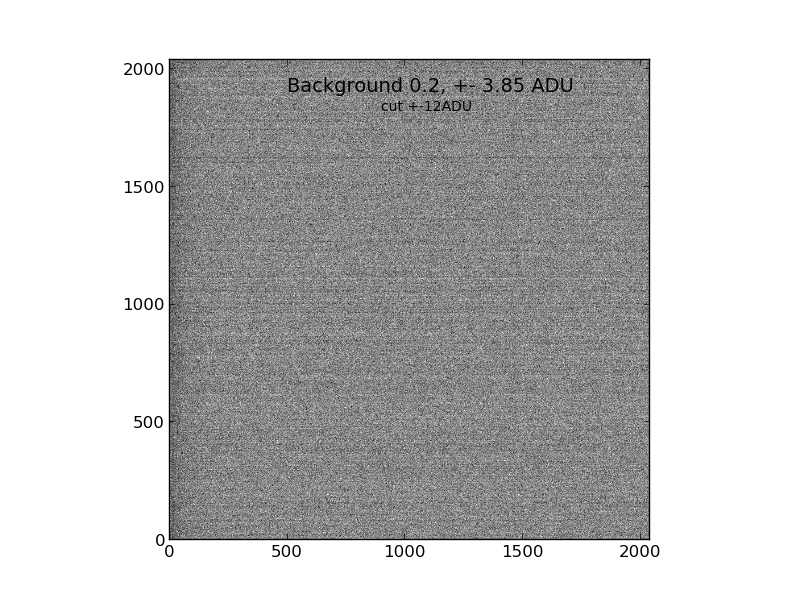
This master bias frame is combined from 11 bias frames,
using iraf/mscred/zerocombine.
The left hand side shows a slight gradient, which is
explained here.
Some structure is easily visible if the detector
is above the normal temperature (warm CCD, below left)
has been heavily overexposed (remanent, below centre),
or after a controller power cycle (below right).
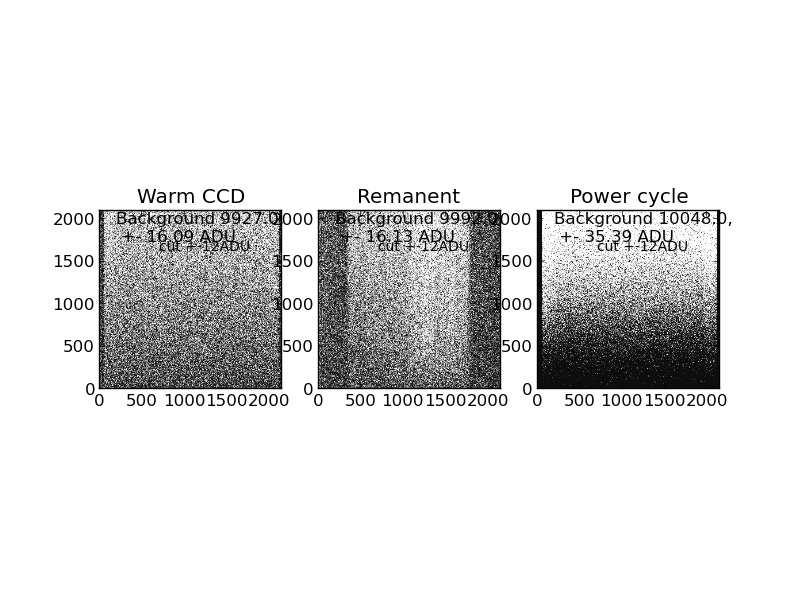
The remanent CCD is "fixed" by time and reading out the detector a few times.
alfosc.masterbias-script:
For a quick check of the CCD one can use a sequencer script
"alfosc.masterbias".
This script takes three
( alfosc.masterbias -s yes )
or more
bias frames, with the default of eleven. The data is analysed
in different ways:
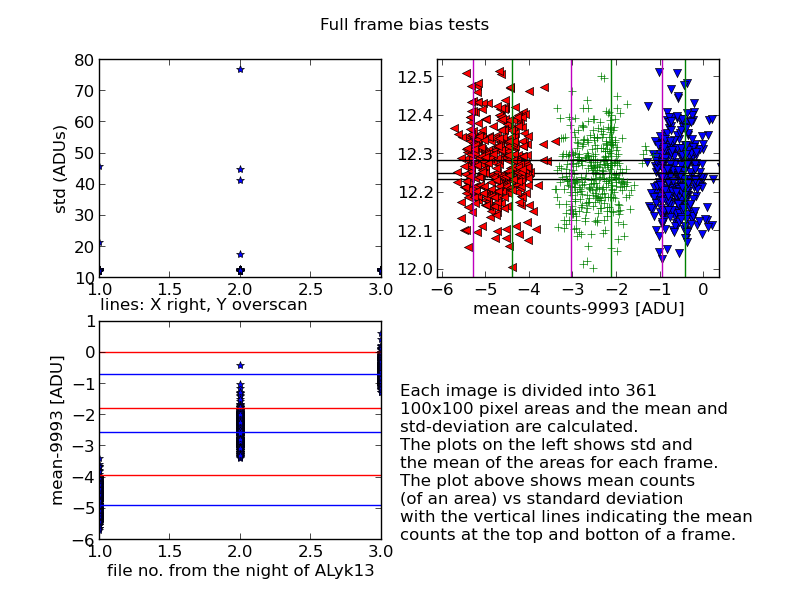
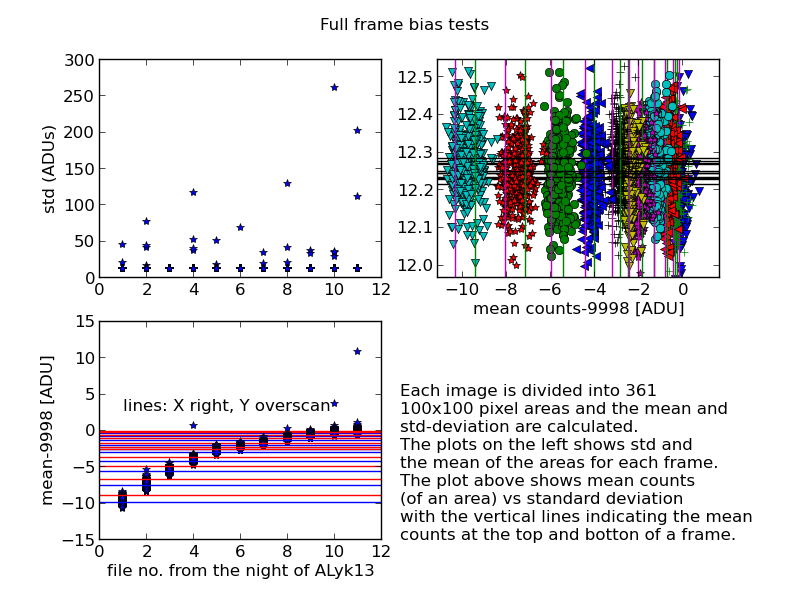
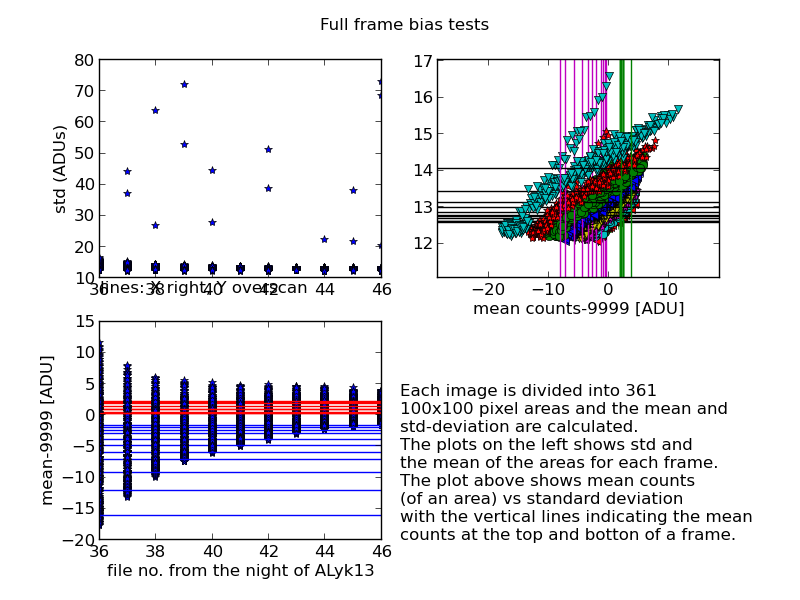
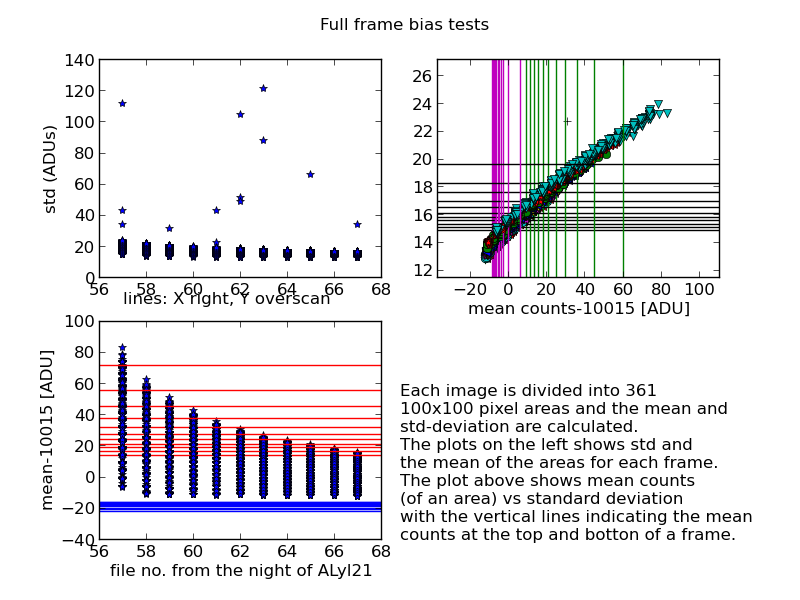
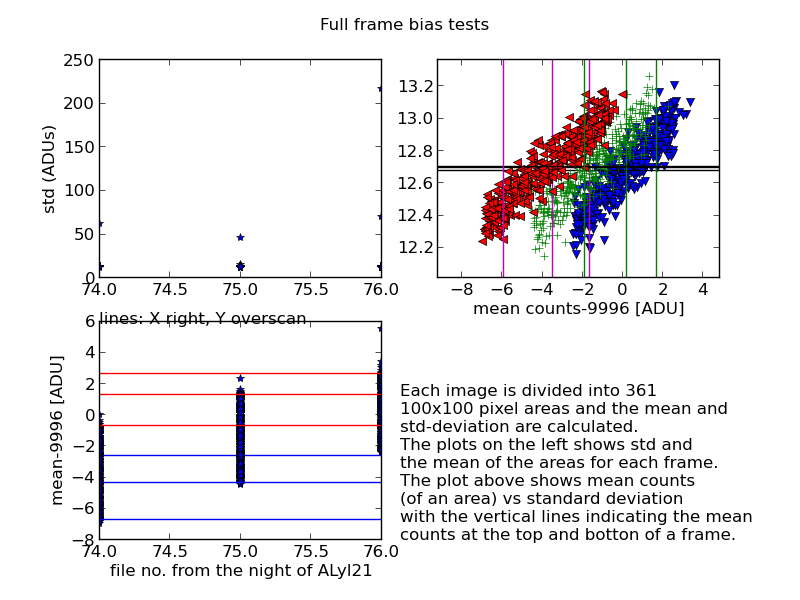
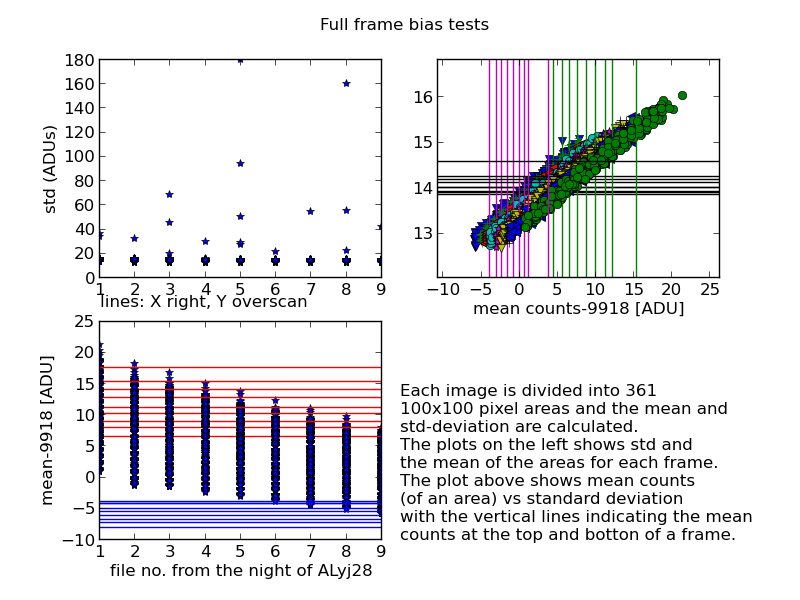
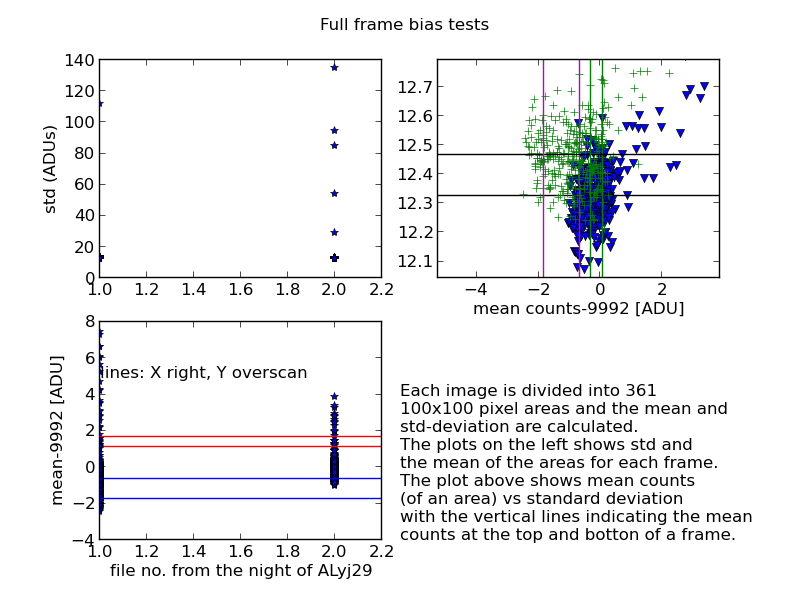
- Dividing a frame in to 100x100pixels ares and calculating
mean, median and standard deviation of each area. Excluding
the borders of the array a full frame is divided into 361 areas.
- Calculating the mean and the median of the X-overscan:
([2104:2146,1:2102]) and Y-overscan ([1:2146,2060:2100])
- Calculating the mean, median and standard deviation of the
bottom ([500:1500,200:600]) and the top ([500:1500,1400:1800])
of the imaging area
- For consecutive frames calculating the difference of the two
and dividing by
to estimate the readout noise, so called
Janesick's method.
- If the number of frames is eleven and all frames are OK a master
bias is combined (using iraf/mscred/ccdred).
The master bias is stored in the "/calib/bias/"-directory for the night and
next day it will be availble from "ftp://ftp.not.iac.es/pub/service/calib/alfosc/bias/".
Observations
An operating temperature CCD show that:
- X- and Y overscan, top and bottom of the imaging area show
similar mean counts, typically the difference is less than 1.5 ADUs.
See the red and blue horizontal lines on the bottom left panel.
- the average standard deviation of the 361 sub areas is typically
less than 12.3 ADUs (the black horizontal line on the top right panel).
The distribution of the standard deviations
show standard deviations typically less than 0.6. The outliers are shown in
the top left hand side panel.
- the mean counts of the sub areas have typically
a scatter less than 0.6 ADU. (top right hand panel y-axis).
- During the first consecutive readouts (about 5)
the mean counts are increasing, typically few ADUs and after that
they level (bottom left panel).
- Typically the Janesick's method show slightly smaller readout noise value than
the measured scatter (~12.1 vs ~12.25).
A CCD with remanent charge:
- The mean value of a consecutive bias frames increases, however the scatter can be so large
that the increase is difficult to see (the left hand panel)
- The scatter of the mean values decreases (bottom left hand panels)
- The average standard deviation has elevated value (in comparison to the "normal CCD")
- the difference between the X and Y overscan (and the top and bottom ) is greater than 1.4
- the mean count vs standard deviation show clear correlation
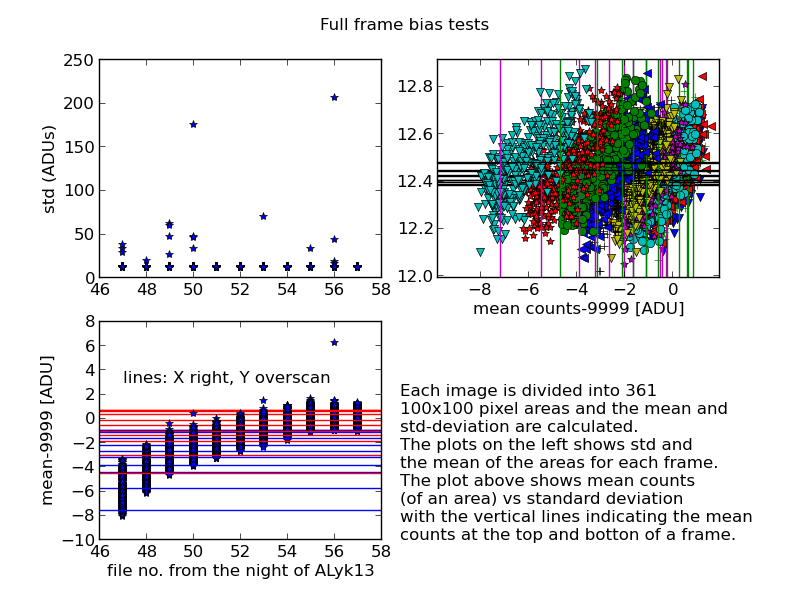
After power cycling the CCD-controller:
- The average counts are typically more than expected
- The average counts decrease in the bias sequence, however after time
the counts start to increase and the pattern is similar to the "remanent
charge".
- The scatter of the mean values decreases (bottom left hand panels)
- The bottom (low y-coordinte) has about constant counts
- The structure can be visible after 30 minutes power cycle
(see image below on the right), with similar pattern to a remanent
charge.
Warm CCD:
- The average counts are typically less than expected, typically < 9990ADUs
- The average counts decrease in the bias sequence, this is the opposite to a
normal CCD or with the remanent charge
- The scatter of the mean counts is high and nearly constant.
- the mean count vs standard deviation show clear correlation
Some obsolote old controller ccd bias stuff
|