![]()
![]()
![]()
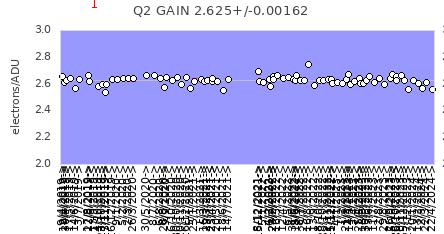
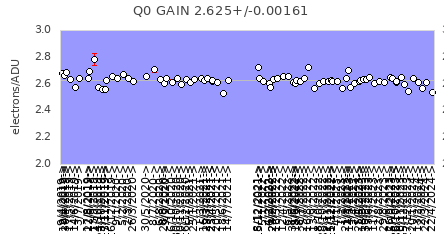
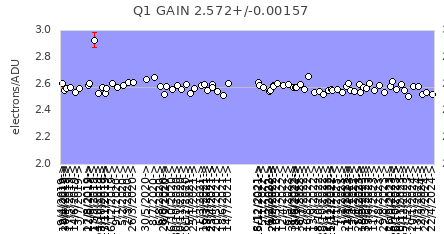
Monitoring the array in ramp-sampling modeShow NOTCam R-S database Gain for each quadrantPlotted line correspond to mean value X-axis tics are plotted every 10th day
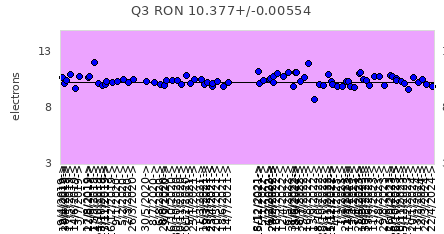
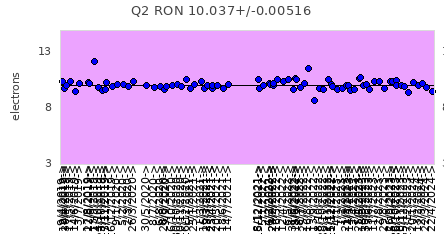
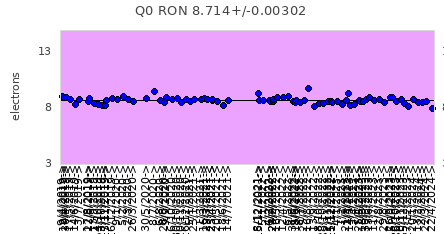
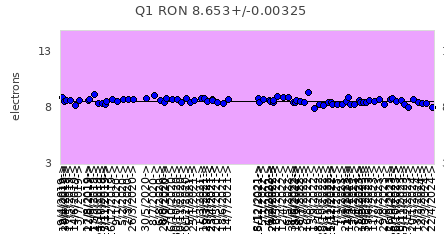
Read out noise for each quadrantPlotted line correspond to mean value X-axis tics are plotted every 10th day
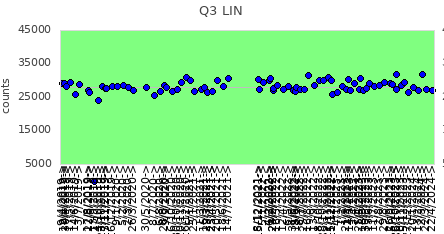
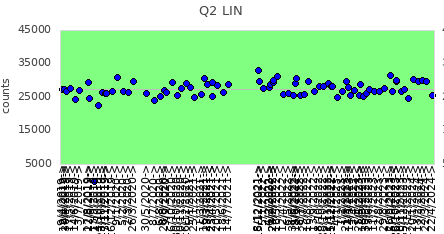
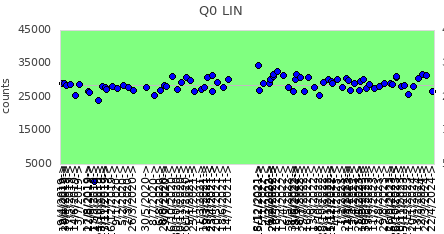
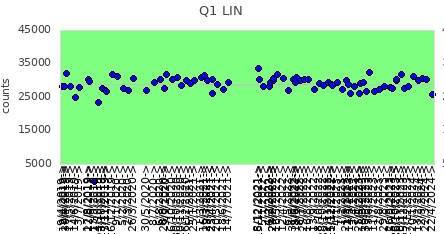
Linearity limit (1%) for each quadrantPlotted line corresponds to mean value X-axis tics are plotted every 10th day
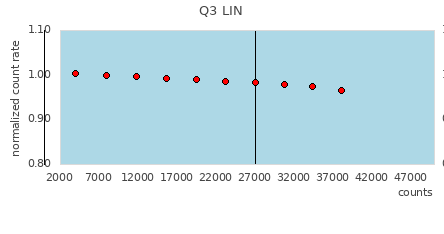
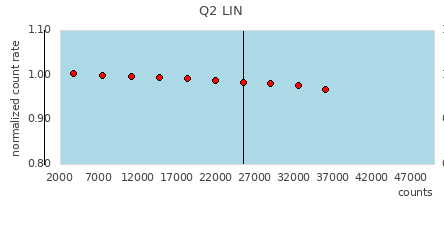
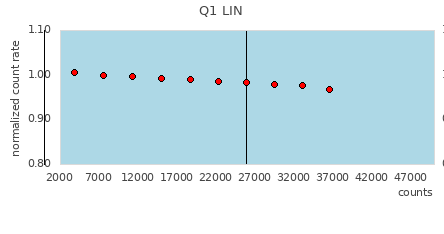
Linearity for each quadrant from newest dataVertical lines correspond to 1% and 3% non-linearity, respectively
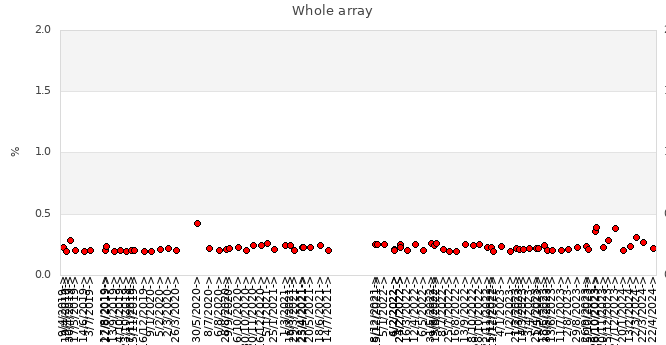
Amount of zero pixels (%) and zero pixel mapX-axis tics are plotted every 10th day
Zero pixel map shows where zero pixels are in the latest data. 
Full resolution dead pixel map Amount of hot pixels (%)Fraction of pixels that deviate more than 8-sigma from mean value. Used exposure time was 36 seconds. X-axis tics are plotted every 10th day 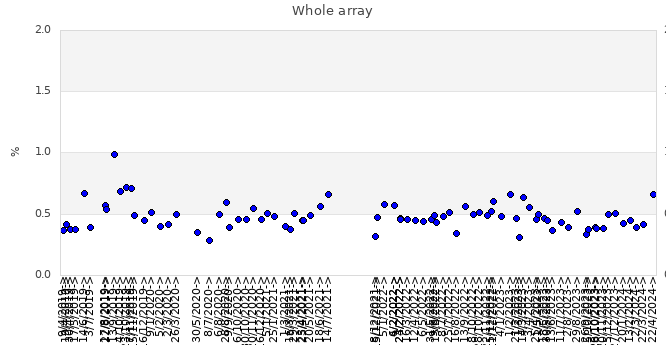
Amount of cold pixels (%)Fraction of pixels that deviate more than 8-sigma from mean value. Used exposure time was 36 seconds. X-axis tics are plotted every 10th day 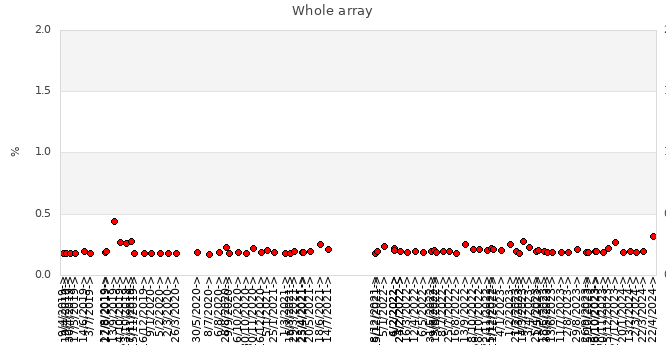
Temperature of the arrayMean temperature of the array during test. Minimum and maximum temperatures during the test are indicated by the error bar. X-axis tics are plotted every 10th day 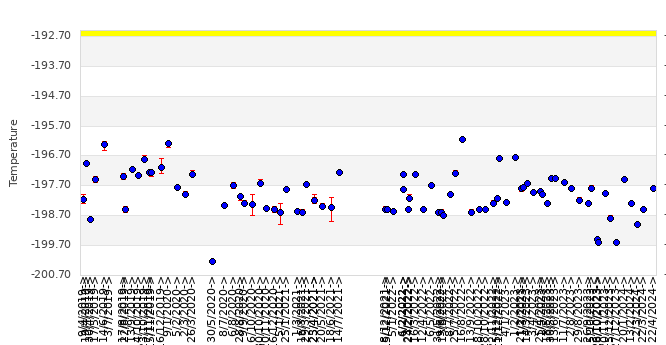
Dark current count dependency on exp timeData has been taken using < frame 4.2 10 > command Red points correspond to latest data Blue lines refer to 5 previous situations Number of counts per known exp time, 0s included 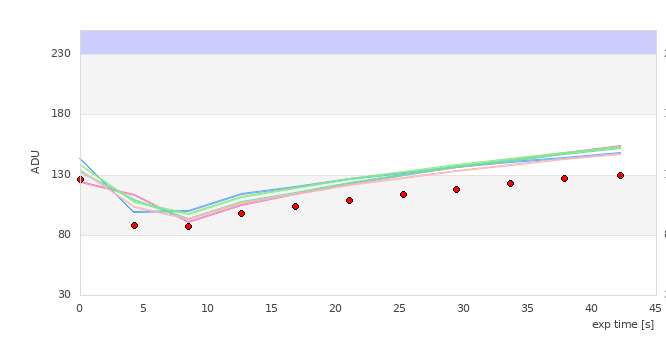
|
|||||||||||||||||
|