
![]()
![]()
![]()
![]()
Commissioning the Z and Y filters
Fig 1. ZYJHK transmission curves and the atmospheric transmission (white) in the near infrared.
ZeropointsStandard stars with UKIRT/WFCAM Z and Y measurements, such as Rubin149 (AS16) and M3-193 (AS26), were used to determine the NOTCam ZYJHKs zeropoints for this night (for 1 e/s, gain = 2.5 e/adu). We used fixed standard extinction in JHKs, and for Z and Y we interpolated the standard values between the I-band (0.04 mag/airm) and the J-band (0.086 mag/airm) to be 0.05 mag/airm for Z and 0.07 mag/airm for Y. No colour terms are included in the fit.
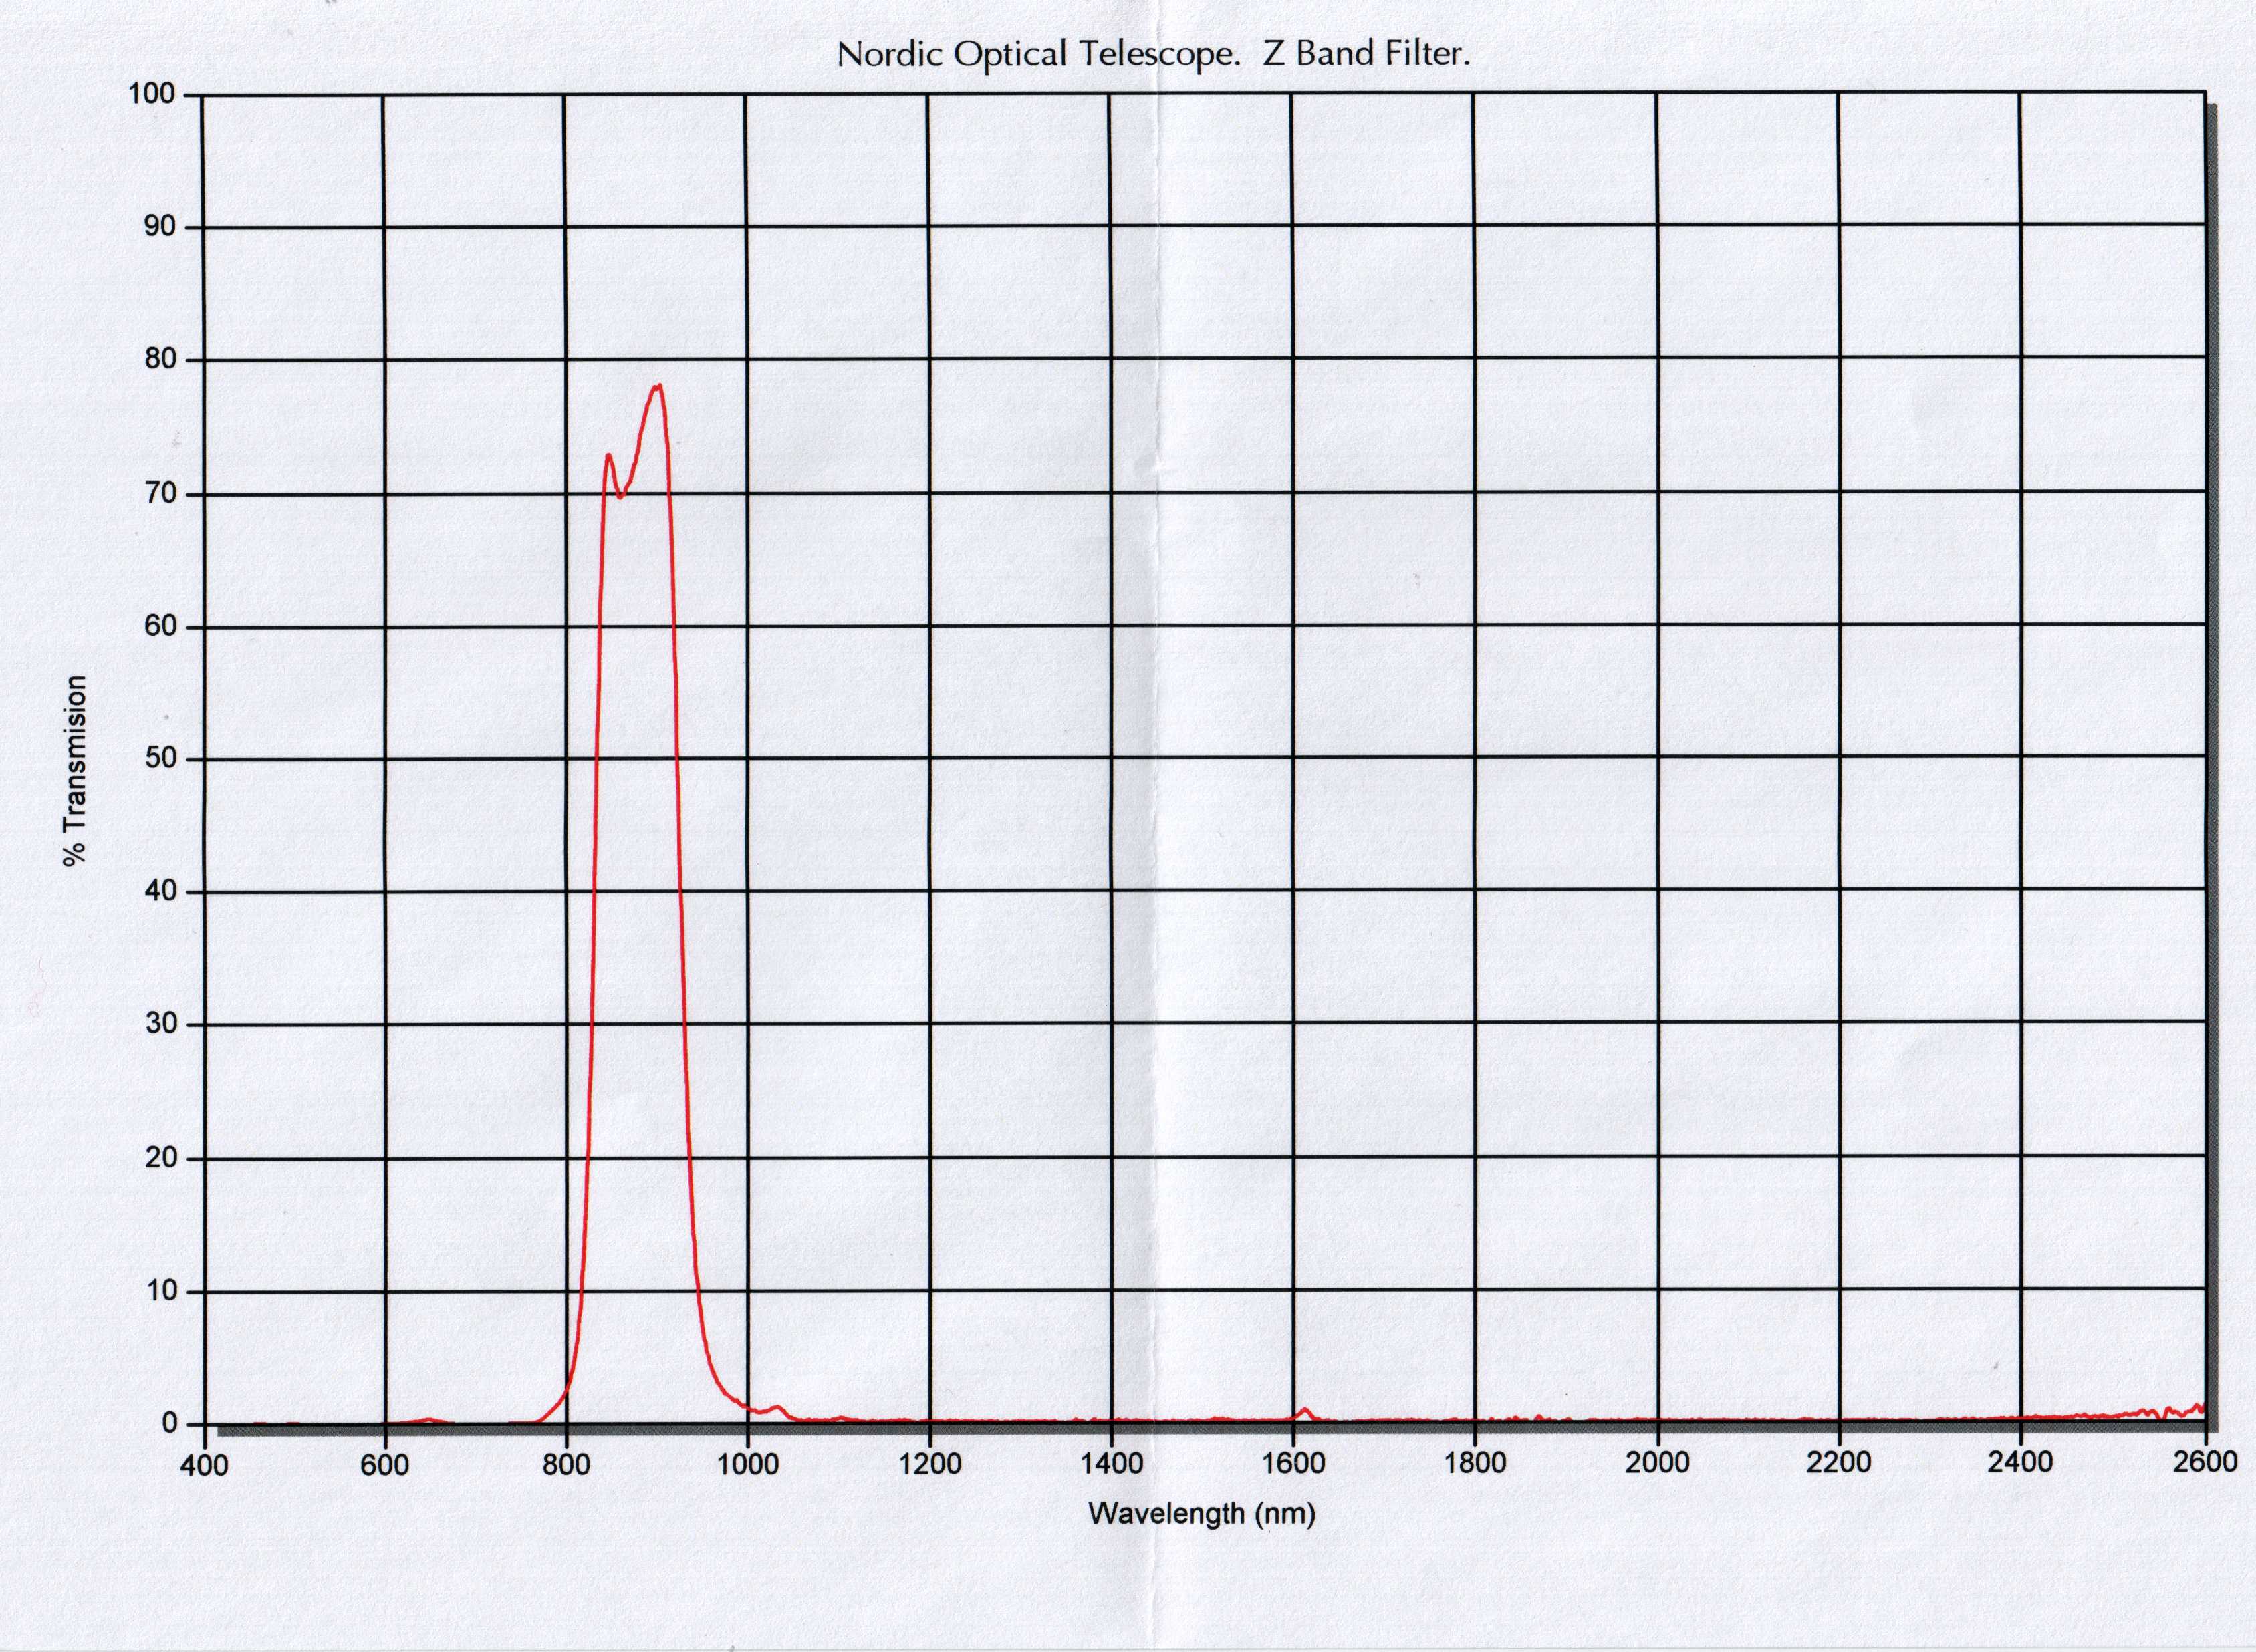
The WFCAM/UKIRT zeropoints for (1 electron/sec) were taken from this document, and the Hawk-1/VLT zeropoints were taken from the Hawk-1 trending system. The UKIRT(3.8m)/NOT(2.5m) mirror ratio introduces a shift in the zeropoints of 0.9 mag, and VLT(8.2m)/NOT a shift of 2.6 mag. We note that the Y, J and H filters are the standard Mauna Kea Observatories (MKO) Near-Infrared filters both for NOTCam and WFCAM (fabricated by the same company). The NOTCam K-band is Ks, however, while WFCAM K-band is standard MKO K. Also, the Z-filters are different (made by different companies), and the NOTCam Z has a lower peak transmission (~ 75%) compared to the WFCAM Z-filter (~ 97 %). For comparison, the ALFOSC SDSS z' band zeropoint is 23.4 mag, and the StanCam one 23.25 mag.
Sky backgroundsThe backgrounds were determined using the same standard star images as above for the zeropoints. The highest uncertainty in the determination of the sky level comes from the dark subtraction, especially for short exposures and low-backgrounds, where the NOTCam dark may become a significant component. NOTCam darks obtained with the same exposure mode as the observations, but at a different time, may not be a good representation of the real dark (but the best we can do).It turns out that 12/2-2011 was an extremely cold and dry night with exceptionally low backgrounds in the near-IR, in fact the lowest we have measured in a long time. While the NOTCam Y-band sky background is close to that measured with UKIRT/WFCAM, the NOTcam Z-band background is, however, almost 5 magnitudes brighter! It is even slightly higher than the Ks-band background. Moreover, the Z-band background is very stable throughout the night, and does not seem to depend on the presence and/or distance to the moon for the cases measured 12/2-2011. News: After flipping the Z-filter around and putting a mask around the edges to diminish leaks a new measurement of the sky level was made on June 10th. The air temperature was much higher than on Feb 12th, and the background in Ks is much higher, while the Z-band remains at the same, a clear improvement, but still a very high background.
Z-band leakWhere does the Z-band background come from? We knew that some red leak was to be expected. Based on the Z-band transmission curve provided by NDC Infrared Engineering, we estimated that the total red leak, i.e. leaks from wavelengths longer than the Z-band, would correspond to ~ 2% of the total in-band transmission. This assumes the sensitivity of the detector to go to zero at 2.579 microns, as documented by Rockwell. Accounting for the about 100 times higher sky emission at 2.2 micron than at 0.88 micron, we would expect that the leak would amount to twice the in-band Z background. We should thus expect to have a relatively high background of 3 times the UKIRT Z-band sky, or up to ~ 30 e/s/pix, but what we have is 700 e/s/pix.
 Fig 2. Z-band sky image. The level goes from 280 adu/sec at the top to 310 adu/sec at the bottom. A sky image obtained from median filtering stellar field observations is shown in Fig. 2 above. The Z-band sky images have a vertical gradient, which is always in the same direction, no matter telescope pointing or moon distance. In order to determine where this excess background comes from, we obtained both imaging domeflats (using the NOTCam QC lamp, a normal bulb), as well as spectroscopic flats crossing the Z-filter with the J, H, and K' filters mounted in the stop wheel. The spectroscopic flats were taken with the halogen lamp, using Grism #1 and the 128 micron slit. Neither on imaging domeflats, nor on spectral halogen flats do we get any emission when crossing the Z filter with J or with K'. When crossing Z and H we see a minor leak, and in the spectral flat it is also well defined in wavelength region ~ 1.6 microns, where a minor leak was indeed expected from the Z-band transmission from provider. See Fig. 3. 


Fig 3. Halogen flats (exp=15). Z (left) peaks at 20000 adu, Z+H (middle) peaks at 900 adu, and Z+K' peaks at 350 adu (basically a dark).
Thus, it seems clear that the major leak we are investigating, does not originate from the JHK' wavelength region. The K' band sensitivity, as well as the Ks one, goes to zero at 2.340 microns, however, and the leak in the Z-filter may originate from wavelengths longer than the K' band (cf Fig. 1). Judging from domeflats taken with the lamp ON and OFF (exptime being equal) there is a major thermal component in the Z-band background shown in the table below. This supports the hypothesis that much of the leak is thermal emission that may originate from beyond the K' band. News: After flipping the Z filter around and adding a mask to take out leakage at the edges, new measurements were made on June 10th, and a clear improvement is seen. (Note that the thermal fraction is strongly temperature dependent and one must scale the values relatively to the K filters measured at the same time.) Nevertheless, there is still a significant thermal leak in the Z-band filter!
When switching off the halogen lamp to try to catch the thermal leak through the the grism (+ slit), however, we see nothing. We would expect thermal emission to leak through the grism, since the grism material has 95% transmission at 2.4 micron and probably at least 60% at 2.6 micron. The difference in light path between imaging and spectroscopy, apart from the grism itself, is the slit which limits the incoming light beam in spatial extent. This suggests that the Z filter mounted in the standard way may leak at the edges, though no leak is spotted by looking through the pupil imager (see Fig. 4 below). The telescope is in zenith and the lamp is illuminating from entrance door towards the hatch.

 Fig 4. Pupil Imager Z-band (left) and Y-band (right) images. Taking out the slit to do slitless spectral flats through the Z-band we used the dome lamps (bulbs) since the Halogen calibration lamp became too bright. Below is shown these spectral flats with the lamps ON and OFF, and the difference between the two. Clearly, the thermal leak is indeed detected through the grism. At the top of the image as much as 90% of the flux is from thermal emission. In the centre of the image 75% of the flux is thermal, and at the bottom part roughly 50% is thermal. Putting in the 128 micron slit again to compare for this lamp, there is practically no light coming through, even with the dome lamps ON, as they are too faint.


Fig 3. Slitless spectral flat in Z-band with dome lamp ON (left), dome lamp OFF (middle) and the difference between the two (right) showing the contribution of the lamp itself, subtracting away the thermal leak. Anyhow, combining the spectral flats with and without slit, it is clear that a lot of the thermal leak is actually stopped by the slit, which means there must be leaks around the filter itself. We took images with the pupil imager with the lamps OFF (to look for thermal emission) and with the stop ring in and out. In the left image below taken with the Z-band in and using the pupil imager, the stop ring is in, while in the middle image the stop ring is out. The middle image shows a lot of thermal leak at one side. For comparison, an image without stop ring was also made of the Y-band filter (shown to the right), and this shows no such leak.


Pupil imager imaging with the lamps OFF. The Z-band with the 15mm cold stop (left), the Z-band with no cold stop (middle), and the Y-band with no cold stop (right).
The Z filter is different from the other NOTCam filters in having a non-transparent coating only on one side. It is transparent through most of its thickness, also at the edges. All NOTCam filters are mounted with a spring inside the filter holder to allow for the different thermal expansion coefficients for filters and metal holders as the temperature varies from +30 to -200 degrees Celsius. It would be worth while flipping the filter around in its holder and add a cold stop ring to it.
After flipping filter and adding a stop ringNews: After the Z-filter was flipped around and a 17mm ring was added to it, the pupil images shown below indicate that the leak at the edges has gone completely.


Pupil imaging with the lamps OFF. The Z-band with the 15mm cold stop (left), the Z-band with no cold stop (middle), and the K-band with no cold stop (right). The new measurements were made on June 10th, and a clear improvement is seen in the background. Note that the thermal fraction is strongly temperature dependent and one must scale the values relatively to the K filters measured at the same time. The Z/Ks background ratio used to be 1.2 and after stopping the leak at the edges, it went down to 0.88. That is still a tremendously high value which is due to the presence of a significant thermal leak in the Z-band filter. See the tables above for updates on measured numbers. Conclusions on Z-band leakThe leak of the Z-band filter is still substantial, and mainly originating beyond 2 microns. We are currently investigating the possibility to filter it out by installing a blocking filter in the other filterwheel. A traditional "PK50" blocks completely only from 2.85 microns, however, and blocks almost as much in the Z-band as at 2.4 microns (see example of PK50 transmission curve, and is not an option. Ideally we would want a filter that blocks everything redwards of about 1 micron. An alternative, though not as good, is to add a 5mm thick simple BK7 glass to diminish the leak. We are currently asking quotes for an optimized blocking filter.Image qualityNGC 2506 was observed in a 9-point dither using the exposure command "frame 5 5" per sky position, giving a total integration time of 225 seconds per filter. The Z-band image (left) and Y-band image (right) shown in Fig. 5 are the final images after quick-look reductions doing flat-fielding, sky subtraction, distortion correction, image registration, shifting and combining. The images are not trimmed and show the full 4' NOTCam FOV (1024 pixels times 0.234''/pix).The SExstractor results on the 9 individual raw Y-band images showed an average FWHM of 0.68 ± 0.03 arc seconds and an average ellipticity of 0.07 ± 0.04 based on ~ 200 stars per image. For some reason SExstractor results were not found for the Z-filter, but it shows similar values.

 Fig 5. Reduced Z-band (left) and Y-band (right) image of NCG2506. No apparent ghosts seen. Several stars are saturated in the Y-band image, causing memory effects in the individual images which however is filtered out in the combined image. Saturation also causes charge to bleed along readout lines, not only in the quadrant where the star is, but by crosstalk to the same lines in all quadrants. The intensity level of these lines is typically 5-6 adu, but because the Y-band background is so low and its standard deviation is less than 2 adu, horizontal lines from saturated stars are clearly visible in the final image. In principle, they can be corrected/subtracted by collapsing a median along lines. In this image, however, it doesn't work well because the distortion correction causes slight bending of the lines. Below is a colour coded image based on Z, Y, and Ks images of M104. The images were obtained in beamswitch mode using "frame 4 4" per position to have a total exposure time of 144 seconds per filter. The images were reduced using the notcam.cl quick-look reduction package with distortion correction included. Again, images are not trimmed, but the whole NOTCam 4' FOV is shown. The dark shadow to the upper right is the negative image of the galaxy (beamswitch step size was only 180''). North is towards the upper right corner.
 Fig 6. M104 colour coded Z, Y and Ks image.
|