![]()
![]()
![]()
![]()
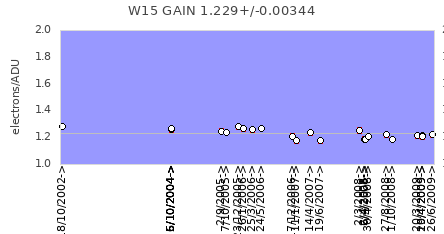
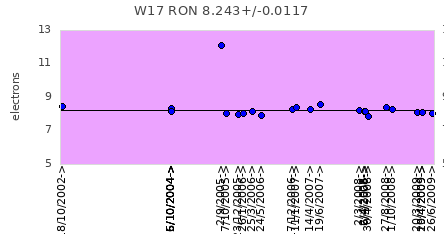
Monitoring the MOSCA CCDsUnbinned imagesShow MOSCA database Gain for each CCDPlotted line corresponds to mean value X-axis tics are plotted every 10th day
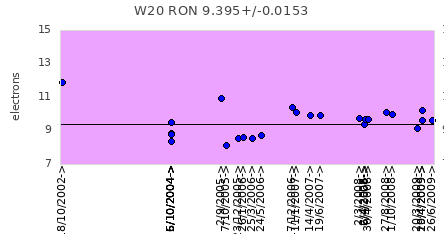
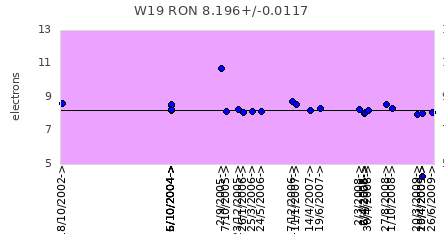
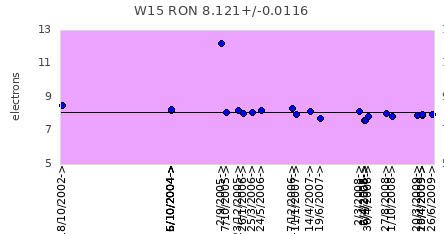
Read out noise for each CCDPlotted line corresponds to mean value X-axis tics are plotted every 10th day
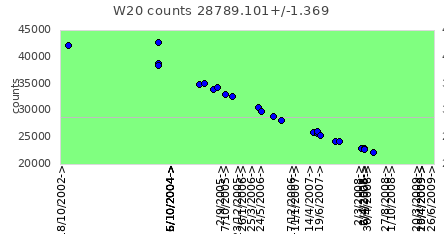
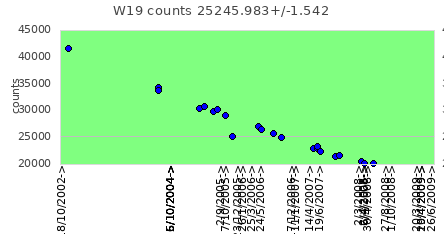
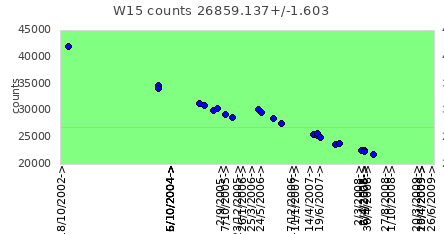
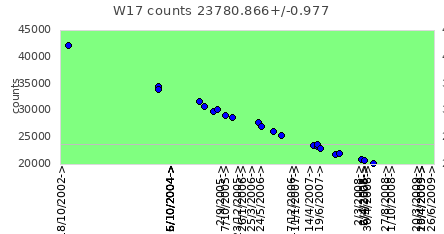
Number of counts in flatfields for each CCDPlotted line corresponds to mean value X-axis tics are plotted every 10th day
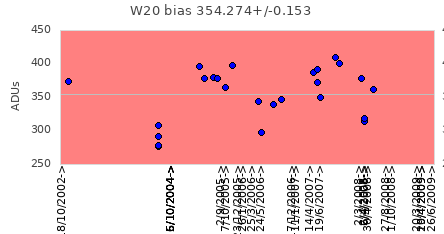
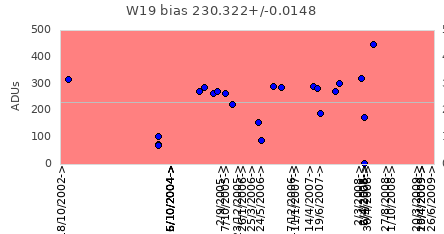
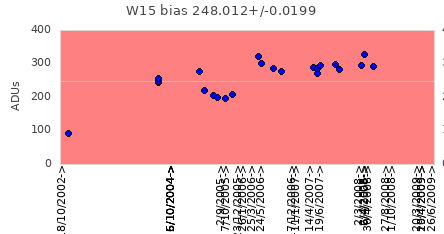
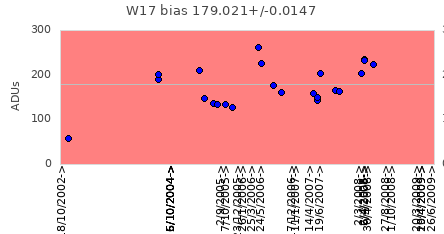
Bias level for each CCDPlotted line corresponds to mean value X-axis tics are plotted every 10th day
|
||||||||||||||||
|