New NOTCam Science Grade Array (SWIR3)
Content of this page:
Detector overview
The new Science Array was
installed in NOTCam on 7/12-2007 after the electronics had been upgraded
and tested.
For data taken before this date, check detector characteristics
of the Engineering Array or the
First Science Array.
NOTCam is offered with two possible readout modes: the standard
reset-read-read mode and a ramp-sampling mode
(multiple non-destructive reads during the integration). Read more
about this in the NOTCam User's Guide.
For more details see the detector quality control results for both
readout modes at:
reset-read-read mode
ramp-sampling mode
Preliminarily, the data for the new Science Array has been plotted
together with the data for the old Science Array for comparison.
Cosmetics - bad pixels
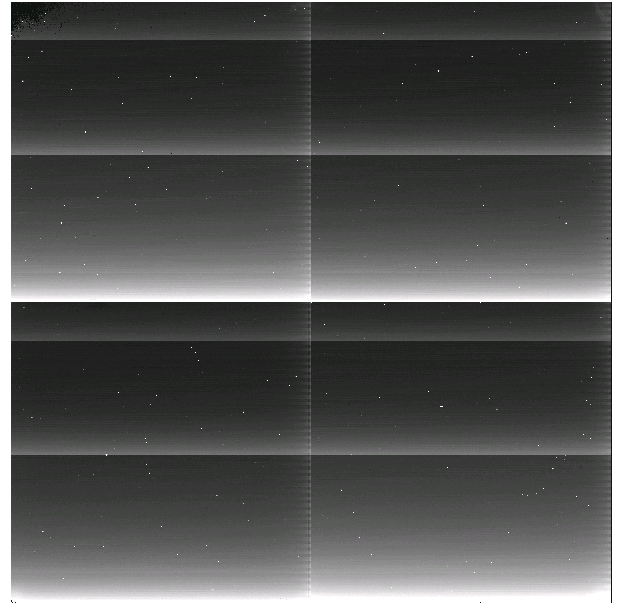
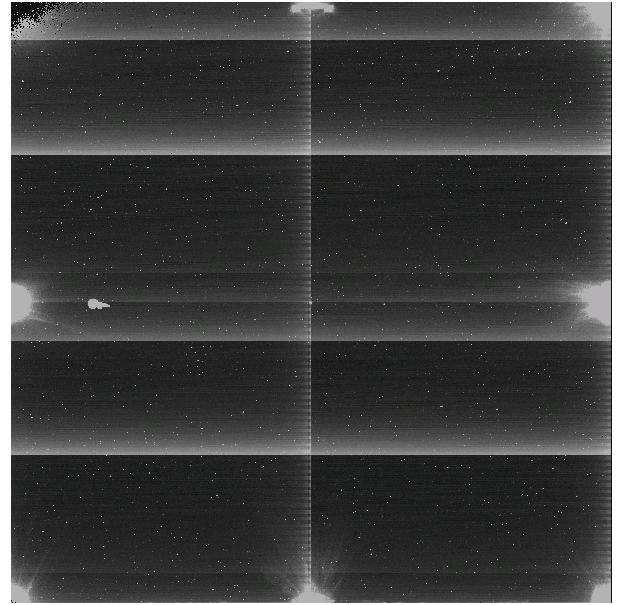
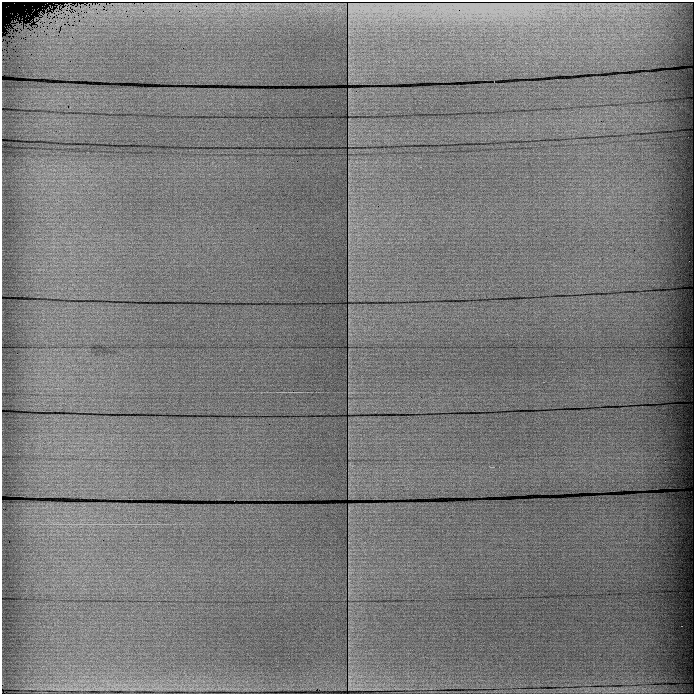
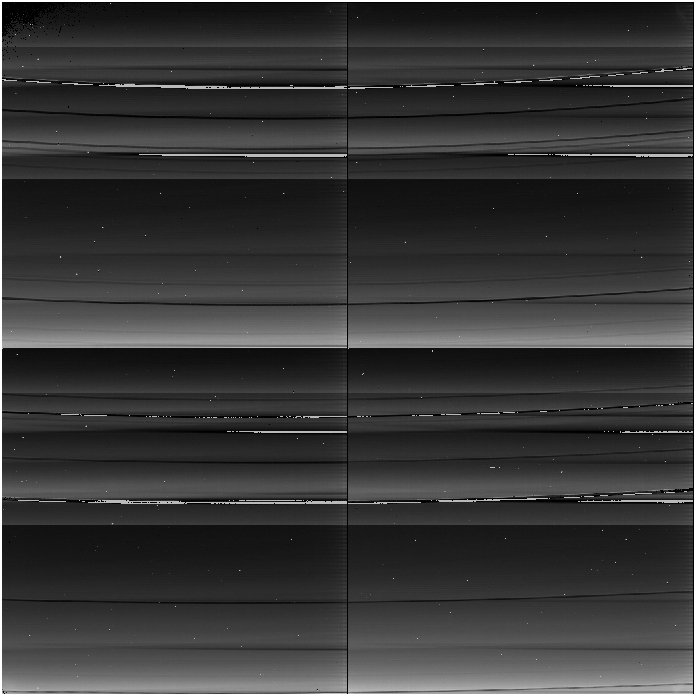
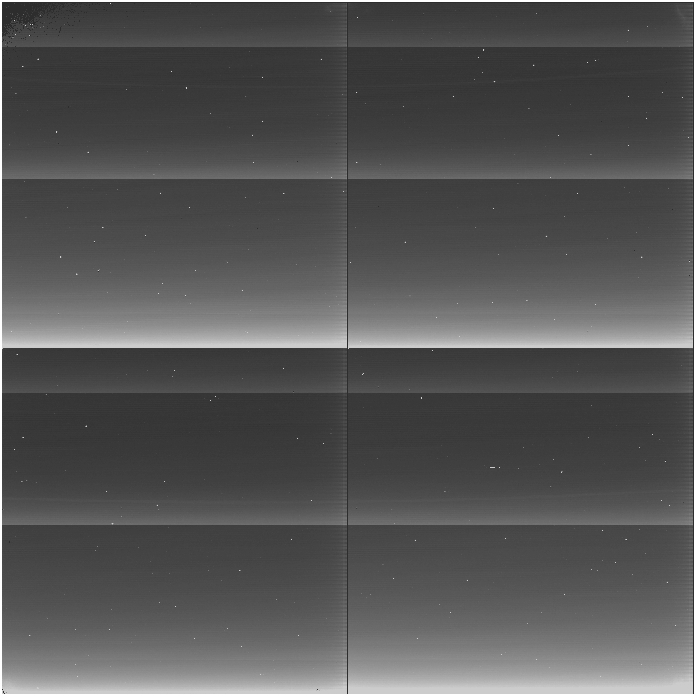
Fig 2: Two dark images obtained with the reset-read-read mode
(command dark t). Integration time (t) is 0 seconds
(left) and 42 seconds (right). Note the shift register glow and the higher
number of hot pixels on the 42 s long dark integration. The increase
of hot pixels with exposure time has to be looked at more carefully
(data is obtained), but a preliminary result is that we do not seem
to have those accumulating groups of hot pixels as with the previous
Science Array.
The dark images show a cosmetically clean array with only a few bad
areas. The largest bad area is about 33 x 13 pixels centred on x=150,
y=508, another one is about 10 x 5 pixels centred on x=390, y=586.
(The lower left corner is pixel x=1, y=1.)
The total number of bad pixels is about 0.8 %, of which most are
located in one corner (upper left). The bad pixels are both zero value
pixels, hot pixels and cold pixels. A pixel is defined as hot/cold if
it deviates by more than 6 sigmas from the mean level. Both darks and
high S/N ratio domeflats are used to define the bad pixels.
The four quadrants are read simultaneously. The fast readout is in
the horizontal direction starting in the lower right corner of each
quadrant. Because the controller can not handle the first column, we
have a dead column at x=1024 as well as at x=512. (NB! Please, note
that since January 2006 the images are flipped in x-direction, and
the above is valid for data taken from 2006 and onwards.)
Amplifier glow starts to show up on 12 second darks at a level of 500
adu. This effect drowns in the background for broad band imaging and
apparently subtracts out well.
Dark level
The behaviour of the dark level with exp time is not well understood.
Readout noise
The readout noise in [e-].
| Date |
Readout mode |
Quad 0 |
Quad 1 |
Quad 2 |
Quad 3 |
| 13-Dec-2007 |
r-r-r |
9.8 |
10.1 |
10.7 |
10.5 |
| 13-Dec-2007 |
r-s |
9.7 |
10.0 |
10.6 |
11.4 |
reset-read-read mode
ramp-sampling mode
Please, check the NOTCam User's Guide
for a description of the two different readout modes available with
NOTCam.
Gain
The gain in [e-/ADU].
| Date |
Readout mode |
Quad 0 |
Quad 1 |
Quad 2 |
Quad 3 |
| 13-Dec-2007 |
r-r-r |
2.50 |
2.48 |
2.46 |
2.41 |
| 13-Dec-2007 |
r-s |
2.48 |
2.43 |
2.44 |
2.50 |
reset-read-read mode
ramp-sampling mode
Non-linearity
While the saturation of this detector starts at 56000 ADUs the array is
found to be linear to 1% accuracy up to about 20000 ADU on the average.
For each readout mode you can check the non-linear behaviour for each
of the four quadrants from the monitoring data:
reset-read-read mode
ramp-sampling mode
Detector flat field
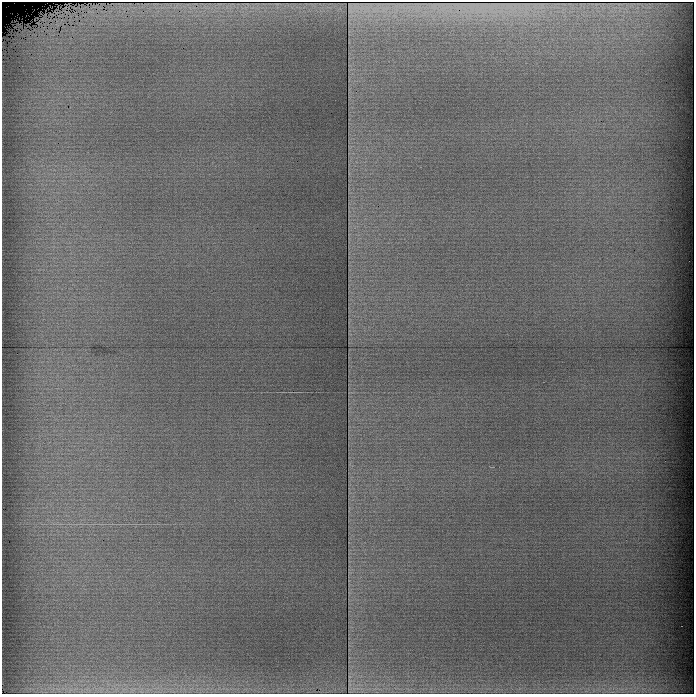
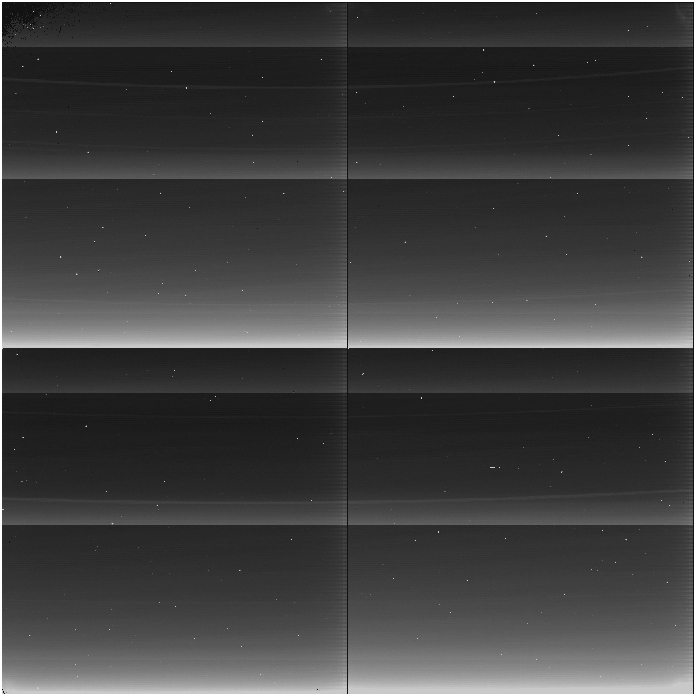
Fig 6: Processed flat field obtained from 8 differential twilight flats
taken with the WF camera through the Ks band. The differential method
(pair-wise subtraction of "bright" minus "faint" images) is used to
eliminate the thermal contribution from the master flat.
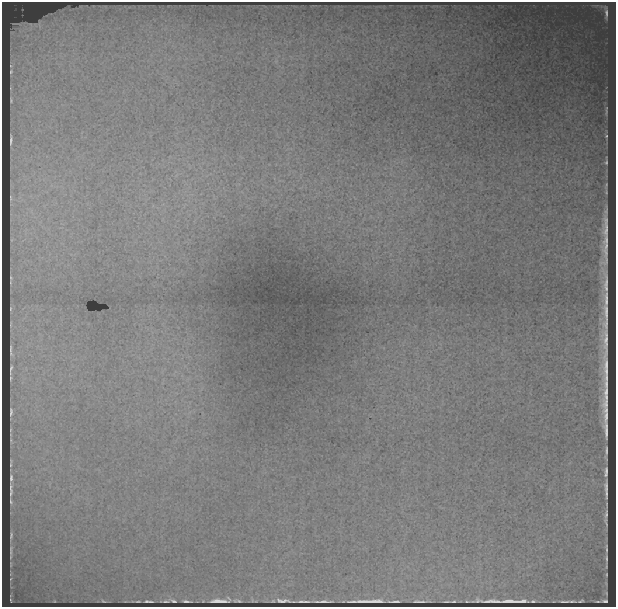
The detector flat field looks relatively flat and has few disturbing
features. The figure above shows the master flat obtained from 8
differential twilight images for the WF camera and the Ks filter. The
standard deviation in small boxes of 20 x 20
pixels is less than 1%. The deviation over the whole field is ±
3%, i.e. flatter than the previous Science Array and much flatter than
the Engineering Grade Array.
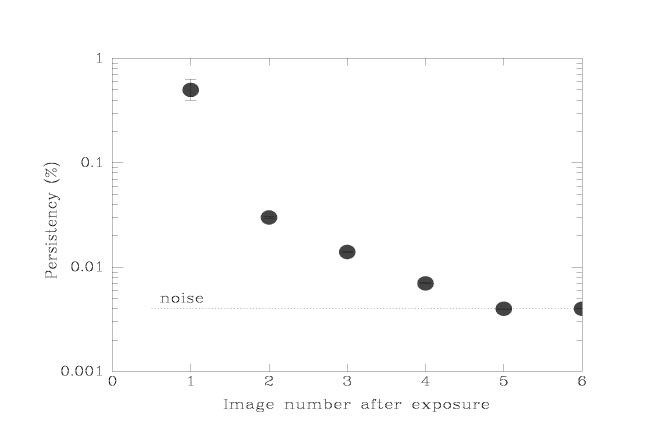
Memory effect (charge persistency)
There is charge persistency (memory effect) at a level of 0.5 %
on the first subsequent image. On the second image the level is only
0.03 % and on the third 0.014 % before it drowns in the typical noise
level, see plot.
Thus, for the New Science Array (SWIR3) the magnitude of the
persistency effect is smaller than that measured for the
First Science Array and
also the recovery is faster.
Note that the memory effect is negative on the first image and
positive on the subsequent images. This is believed to be due to
a transient change in the gain.
If you can not avoid saturation, it is recommended to clean the array
with a couple of clear commands between each science exposure.
Taking 3 clear commands after the saturated image gives a
memory in the subsequent dark image of only 0.03 %.
The memory effect in detail - readout by readout.
| Image |
Comment |
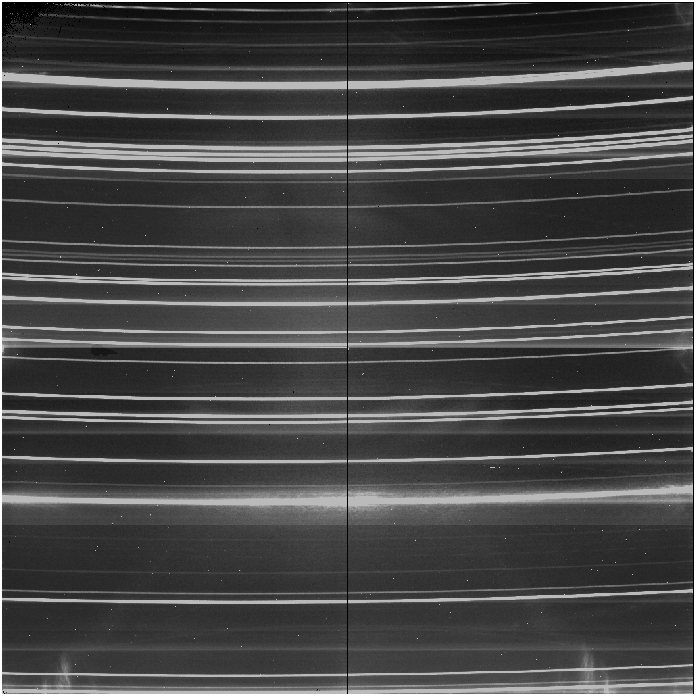 |
An argon arc lamp spectrum with two saturated lines (peak >> 56000 adu). |
 |
The first reset read after the arc image. There is a negative memory of the
brightest lines with peak values > 40000 adu on the arc image. The reset level is at 5500 adu
and the negative peak can be as deep as 5000 adu. |
 |
The 1st dark (reset subtracted). The memory effect is negative and at a level of
0.5 %. Because this is a dark image - i.e. it has few counts all over (about 300 ADUs) - the
negative traces are of even fewer counts. When the pixel values become negative, they wrap around
to > 65000 ADUs (data is saved as unsigned integers), which makes the image look very ugly. If
you have very low background (narrow-band images and/or very short exposures) and sources
peaking > 40000 adu, you should consider wiping the array with a couple of clear commands
in between exposures in order to avoid this effect.
|
 |
The 2nd reset read shows no traces of negative memory. (On the other hand the
pick-up noise pattern is clearly visible.)
|
 |
The 2nd dark (reset subtracted) with a persistency of 0.03 %, meaning that only
the brightest lines with peak values > 30000 adu have a positive memory at a detectable level on
a dark image.
|
 |
The 3rd dark (reset subtracted) with a persistency of 0.014 %, meaning that only
the saturated lines (peaks > 56000 adu) show positive memory at a detectable level on a dark image.
|
Comments to Anlaug Amanda Djupvik
|
